
.svg)
.svg)
TAM, SAM, SOM: Calculating Market Size the Right Way in 2026

Generate B2B Leads with AI?
With LeadScraper, you create suitable B2B lists in seconds. 100% GDPR compliant. No subscription required!
CREATE TEST ACCOUNTTAM, SAM and SOM are the three metrics you use to size a market systematically. They answer three questions: How big is the market as a whole? Which part of it can your business model actually serve? And how much revenue can you realistically capture within the next one to three years?
You need this model in many places: in the pitch deck for investors, in the business plan for your bank or grant provider and as the foundation of your go-to-market strategy. This guide explains the three levels, walks through the formulas with a fully worked example from the DACH region (Germany, Austria, Switzerland) and covers the mistakes that sink most market slides. With the interactive calculator you can model your own market size right inside the article.
- TAM is the entire market at 100 percent market share, SAM is the part your business model can serve, SOM is the share you can realistically win within one to three years.
- The basic formula: number of potential customers times average annual revenue per customer.
- Investors take Bottom-Up calculations far more seriously than Top-Down estimates pulled from industry reports.
- The most common mistake: "We only need 1 percent of a billion-dollar market." The number looks arbitrary and costs you credibility.
- Your SOM only becomes defensible once you can name the actual companies behind it, as a real list with names and contact persons.
What do TAM, SAM and SOM mean?
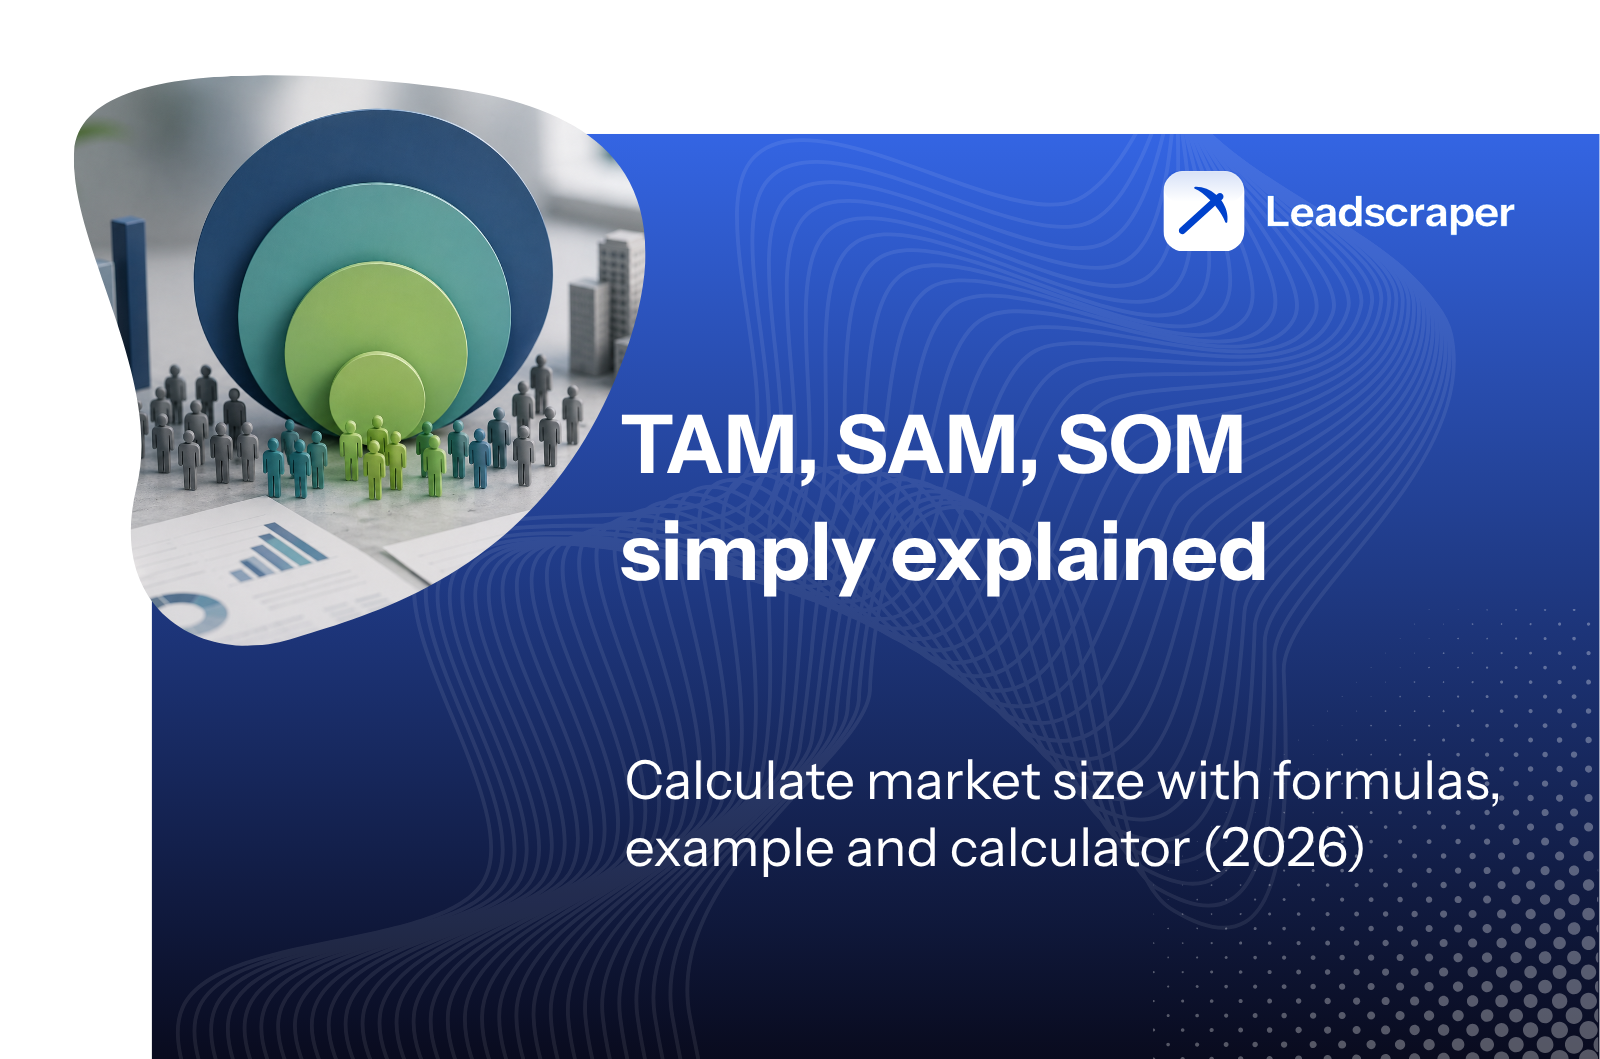
The three acronyms describe the same market on three levels that behave like nested circles. The SOM sits inside the SAM, the SAM sits inside the TAM. Each level answers its own question and is calculated with its own assumptions.
The entire addressable market. The revenue that would theoretically be possible if every potential customer worldwide bought from you. No competition, no capacity limits.
The serviceable part of the TAM. Filtered down to what your business model actually covers: region, language, industry, company size, sales channel.
The realistically obtainable part of the SAM. This is where competition, sales capacity, brand awareness and conversion rates come in. The SOM is the number that has to match your financial plan.
TAM: the total addressable market
The TAM answers a deliberately hypothetical question: How much revenue would be possible if you won 100 percent of all potential customers? This number is never reached. That is exactly its purpose. It shows the upper limit of the market and makes visible which segments you are deliberately leaving out.
The formula: TAM = number of all potential customers × average annual revenue per customer.
SAM: the serviceable market
The SAM narrows the TAM down to what your company can reach with its current business model. A German-language product without an English version excludes most of the global market. A product sold only through direct sales reaches fewer customers than one with self-service. The foundation of a solid SAM is a clear B2B target audience definition: Which industries, which company sizes, which regions genuinely fit your offering?
The formula: SAM = number of reachable customers in your target segment × average annual revenue per customer.
SOM: the realistically obtainable market
The SOM is the most concrete of the three numbers. It accounts for the fact that you compete with other providers inside the SAM and that your sales team can only close a limited number of deals per year. Most young companies capture 1 to 5 percent of their SAM within the first three years. When deriving your SOM, be honest about your own sales capacity. How many deals can your team actually close per quarter? For an overview of the cost items involved, see our guide on how to calculate sales costs.
The formula: SOM = SAM × realistic market share within one to three years.
The two calculation methods: Top-Down and Bottom-Up
There are two established approaches to the calculation. They differ in their starting point and above all in how credible the result ends up being.
Top-Down: from industry study to market share
With the Top-Down approach you start from a big number in an industry study by Statista, Gartner or IDC and filter it down step by step: by region, industry, company size and willingness to pay. It is fast, a first estimate takes an hour. The downside: every filter brings its own assumptions and the errors multiply along the chain. Simply adopting someone else's study figure also shows investors little market knowledge of your own.
Bottom-Up: from a single customer to market size
With the Bottom-Up approach you start at the smallest unit: the individual customer. You count the companies in your target profile and multiply that number by the revenue one customer generates per year. Every assumption can be checked individually. That is exactly why investors take Bottom-Up calculations more seriously. The effort is higher, because you need real data on customer counts, prices and close rates.
| Method | Starting point | Strength | Best for |
|---|---|---|---|
| Top-Down | Industry study, then filters | Fast, good first overview | Early stage, initial orientation |
| Bottom-Up | Single customer, then extrapolation | Verifiable, credible with investors | Pitch Deck, financial planning |
| Combination | Both methods in parallel | Validates your own assumptions | Any market slide under scrutiny |
Run both calculations in parallel and compare the results. If Top-Down and Bottom-Up land within roughly 15 percent of each other, your assumptions are solid. If they diverge widely, you either have a data problem or a reasoning problem. You want to know about both before the investor meeting.
TAM-SAM-SOM calculator: model your market size interactively
The four sliders replicate the Bottom-Up logic directly: customer count times annual revenue gives you the TAM, the SAM filter reflects your business model and the market share yields the SOM.
Move the sliders and watch the three market sizes update live.
Worked example: software for skilled trade businesses in the DACH region
A fictional example makes the logic tangible. A startup builds planning software for HVAC and plumbing businesses. The annual price is 2,400 euros per company. All figures are assumptions that would need to be backed by sources in a real calculation.
Step 1, TAM: By assumption there are around 60,000 HVAC and plumbing businesses in the DACH region. At an annual price of 2,400 euros, that gives a TAM of 144 million euros per year.
Step 2, SAM: The software only pays off from about five employees upward, because smaller businesses get by without dedicated project planning. That applies to roughly 40 percent of the businesses, so 24,000. The SAM therefore comes to 57.6 million euros.
Step 3, SOM: The sales team can realistically win 400 new customers within three years. That equals just under 2 percent of the SAM and a SOM of around 960,000 euros in annual revenue.
| Level | Question | Calculation | Value |
|---|---|---|---|
| TAM | How big is the total market? | 60,000 businesses × €2,400 | €144M |
| SAM | Who can my model serve? | 24,000 businesses × €2,400 | €57.6M |
| SOM | What can I capture in 3 years? | 400 customers × €2,400 | €0.96M |
This example also shows why the SOM has to match your financial plan. Anyone promising 5 million euros in third-year revenue in the pitch deck while showing a SOM of 960,000 euros has an error in one of the two places.
Common mistakes with TAM, SAM and SOM
Anyone who reviews pitch decks regularly keeps seeing the same patterns. These six mistakes cost the most credibility.
A percentage without derivation looks arbitrary. Why 1 percent? Why not 0.1 or 5? Without a Bottom-Up calculation the number is worthless.
"Poor data quality costs companies billions" describes the damage. Your market is the revenue you can generate with the solution.
If you sell accessories for a product, your market is the accessories market, not the product's. A Shopify plugin vendor plays in a different market than Shopify.
Marketplaces and payment providers only keep their commission. At a 10 percent take rate, your own market is one tenth of the transaction volume.
Without a SOM, the bridge to your financial plan is missing. Only the SOM shows whether the revenue targets in your model fit the market.
Markets grow with better solutions. If you only count today's market, you underestimate products that enable entirely new usage.
The last point is the most interesting one because it cuts both ways. The best-known example came from investor Bill Gurley in 2014 in the case of Uber: finance professor Aswath Damodaran valued Uber based on the taxi market of the time, around 100 billion dollars, and arrived at a company value of just under 6 billion dollars. Gurley's objection: the relevant market was cheaper, reliable mobility via smartphone. That market is many times larger than the old taxi market. Uber was later valued in the hundreds of billions. The full argument is documented in the Startup Archive.
What investors really check on the market slide
The market slide is a fixed part of every pitch deck. Sequoia lists "Market Potential" as its own element in its guide to writing a business plan. What gets scrutinized is less the absolute number than the derivation behind it.
Three things matter. First: it has to be money that is actually being spent today, or a provable willingness to pay. Second: the calculation must be documented in a traceable way, with sources for the customer count and a price that has been tested rather than wished for. Third: SOM and financial plan have to line up. Your projected revenues must never exceed the SOM.
From the community: In the subreddit r/ProductManagement, the verdict on typical TAM slides is harsh. One widely quoted comment calls the TAM "basically the number you can best defend", another points to the well-known objection that Amazon's TAM was never the book market and Sony's TAM was never rice cookers. Market sizing systematically underestimates what a product team can build from an established position. The whole thread is worth reading, precisely because it openly names the limits of the model. The takeaway is not to skip market sizing altogether. It is to build your numbers so that you can defend every single assumption.
From market model to customer list: making the SOM concrete
The Bottom-Up calculation has a property that is often overlooked: it requires you to actually count your potential customers. At the latest here, the slide exercise turns into sales work. Because once you know your SAM consists of 24,000 businesses, the next question is: Which 400 of them do you win first and who are the contact persons there?
This is exactly where a solid lead foundation pays off twice. A concrete list of the companies in your target segment first of all substantiates your market calculation. Instead of an estimated customer count from a report you can show: these companies exist, this is how many there really are and this is how we reach them. Second, that same list is the starting point for the sales team that then has to actually collect the SOM. Tools like LeadScraper generate such lists fresh and tailored to your target profile, including company data and contact persons. The system checks each company in context to see whether it really fits the profile. It learns from your feedback as you go. This helps especially in the DACH region, where industry structures like skilled trades, guilds or liberal professions are hard to capture with rigid filter categories. For a walkthrough from market definition to a defensible list, see our guide on B2B lead research.
From my own experience: a SOM backed by a real, named list of companies is worth more than any elegant percentage calculation. It answers the question that ultimately interests investors and founders alike: Who exactly buys this and how do we reach those companies?
Conclusion
TAM, SAM and SOM bring structure to a question that decides business plans and funding rounds: Is this market big enough for what you have in mind? The TAM shows the upper limit, the SAM tests whether your business model fits the market and the SOM connects both to your financial plan.
The model becomes defensible through the Bottom-Up calculation: count your customers, test your price, document every assumption and cross-check with a Top-Down estimate. Follow that path and you face investors with a number you can defend, while having defined your target segment so precisely that sales can get started right away. The most useful first step after the calculation is therefore to translate the SAM into a real company list, for example with LeadScraper. That turns the market slide into a working document and the SOM into a target your team can work through company by company.
Frequently asked questions about TAM, SAM and SOM
What do TAM, SAM and SOM mean?
TAM (Total Addressable Market) is the entire addressable market at 100 percent market share. SAM (Serviceable Available Market) is the part of the TAM a company can serve with its business model. SOM (Serviceable Obtainable Market) is the part of the SAM that can realistically be captured as revenue within one to three years.
How do you calculate TAM, SAM and SOM?
The basic formula: number of potential customers × average annual revenue per customer. For the TAM you count all potential customers, for the SAM only those in your reachable target segment. The SOM is the SAM multiplied by the realistically obtainable market share, derived from sales capacity and competition.
What is the difference between TAM and SAM?
The TAM describes the theoretical total market without any restrictions. The SAM filters that market down to what your own business model actually covers, for example by region, language, industry or sales channel. A product available only in German has a much smaller SAM than TAM.
Which of the three numbers matters most to investors?
SAM and SOM get scrutinized most closely. The SAM shows whether the business model maps to a measurable segment. The SOM has to match the financial plan, because projected revenues must never exceed it. A big TAM alone convinces no one if the derivation is missing.
What is a realistic SOM?
Most young companies capture 1 to 5 percent of their SAM within the first three years. More important than an industry benchmark is your own derivation: How many deals can the sales team close per quarter and how many companies in the target segment are even open to switching?
How do I actually count the companies in my SAM?
Through a company list that is tailored exactly to your target profile. Static directories and purchased address lists often map niche profiles poorly. Tools like LeadScraper generate the list fresh based on your target audience description, credit-based and including contact persons. The number of matches then doubles as your documented SAM customer count.
Do established companies need TAM, SAM and SOM too?
Yes. The model comes from the startup world but is used just as much for market entries, new product lines and budget planning at established companies. A SAM of only a few million euros does not justify a large sales team, and the calculation shows that before the investment.

%2520(7).jpeg)